Just as I was thinking I should dive deeper into JavaScript tools for science, Anaconda (a widely used Python distribution) does something amazing; they’re making client-side Python easy and accessible with PyScript! Yay. This reminds me of the potential for edge computing and the sharing of scientific algorithms when Google released PNaCl. One of main difficulties with research is enabling others to reproduce results; Python (and tools like Numpy) have made this easier; but they still leaves out those that are less code savvy. I love the idea of bringing domain knowledge and works from the benchtop directly to the interested user, especially in blog form.
I wanted to see how easy it would be to setup some simple (and powerful) data plotting examples in this Hugo based blog. This details the steps I had to troubleshoot to get multiple examples working on the same page.
Examples
The following examples were implemented from a post here that describes each example in more detail. These examples incorporate some essential scientific tools like tabular data objects with Pandas and plotting with both Matplotlib and Plotly.
Matplotlib and Pandas Example
This example is a direct implementation from the tutorial Create an Interactive Web App with Pyscript.
Weather Data
Some graphs about the weather in London in 2020.
Plotly and Pandas Example
Building on the previous example from How to Use Plotly with PyScript.
Weather Data
Some graphs about the weather in London in 2020.
The Trouble
The issues I ran into were not so bad, but, I figured this might help the next dev.
First Rendering HTML
I was hoping that the HTML could be directly injected into the markdown text; this resulted in a few errors due to the markdown processing of the post page. The python code would be directly rendered to the page instead of executing e.g.
<html>

<link rel="stylesheet"
	href="https://pyscript.net/alpha/pyscript.css" />
<script defer
	src="https://pyscript.net/alpha/pyscript.js">
</script>

<py-env>
  - pandas
</py-env>

<py-script>

print("hello world")

</py-script>

</html>
results in
print(“hello world”)
however, this can be easily remedied by making a Hugo
shortcode. For my build
the html content was put into a file with this path
layouts/shortcodes/pyscript_print_hello.html.
The short code:
{{< pyscript_print_hello >}}
results in
- pandas print("hello world")
Wrong Double-Quote Character
I also had an issue with copying code from pages with example code. Somehow the double-quote was not recognized by the Python interpreter and this resulted in an exception thrown in Pyodide. I’m not sure why I can’t reproduce it now.
Python Interpreter Session
It wasn’t obvious to me that successive py-script runs will execute code in the
same interpreter scope/session. This means that care should be taken when naming
variables and definitions within each script. For example, the plot command
(defined in the examples above) was renamed in each script i.e.:
plot_matplotlibin pyscript_pandas_app.htmlplot_plotlyin pyscript_pandas_plotly_app.html
I suppose this should’ve been expected since the page is the scope.
Conclusion
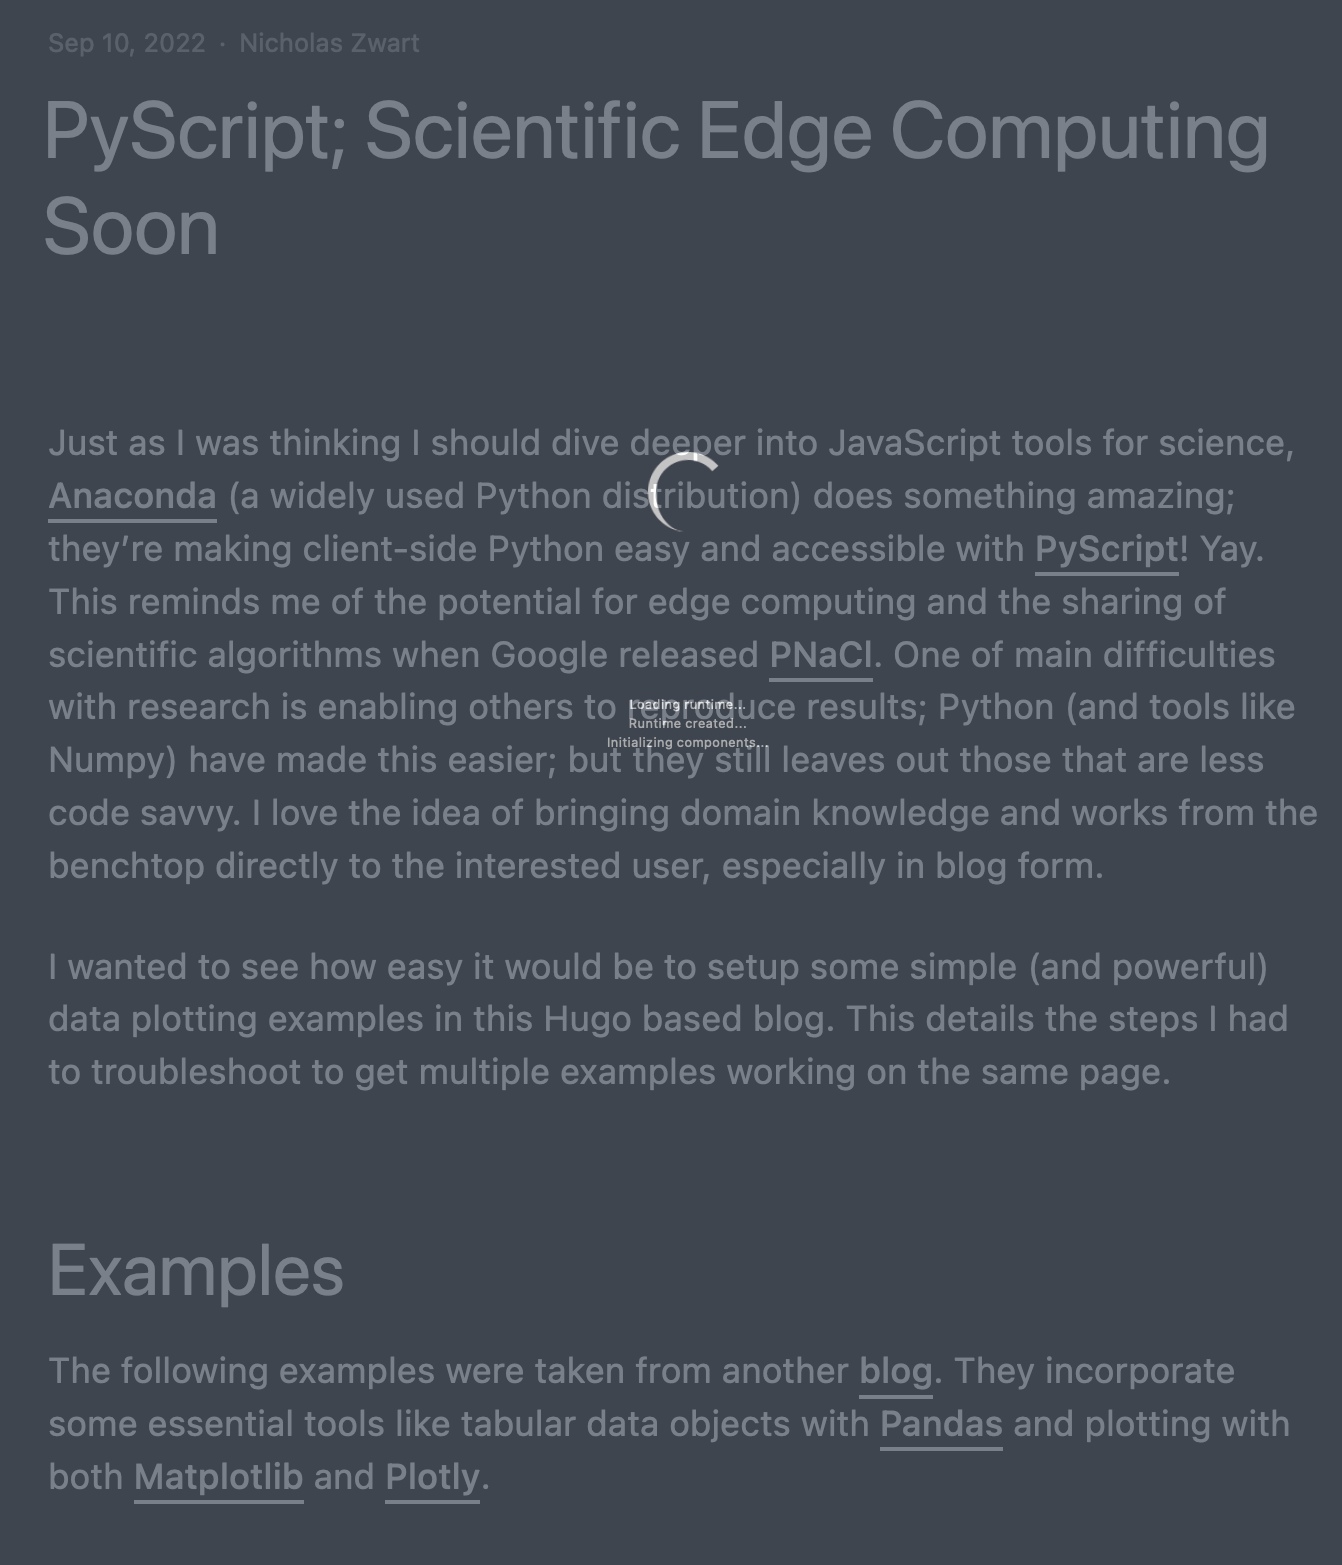
Overall this was really fun to work with. As others have noted, the loading time is much slower than folks would come to expect. PyScript now shows a loading spinner so that your users won’t get confused about the delay in page loading, as shown in the screenshot below.

Each stage of loading is updated in the text below the spinner:
- Loading runtime…
- Runtime created…
- Initializing components…
Embedding the Python code into Hugo ‘shortcodes’ was definitely the right workflow. I’d like to inject as little Python code as possible into HTML; this makes linting and formatting much easier. The current workflow seems to be reliant on pure python modules from PyPi for projects with any substantial complexity. I think a workflow that incorporates pip installs directly from GitHub, would make this ideal.